BMI Alternatives: 8 Better Body Composition Metrics (Clinical Guide)
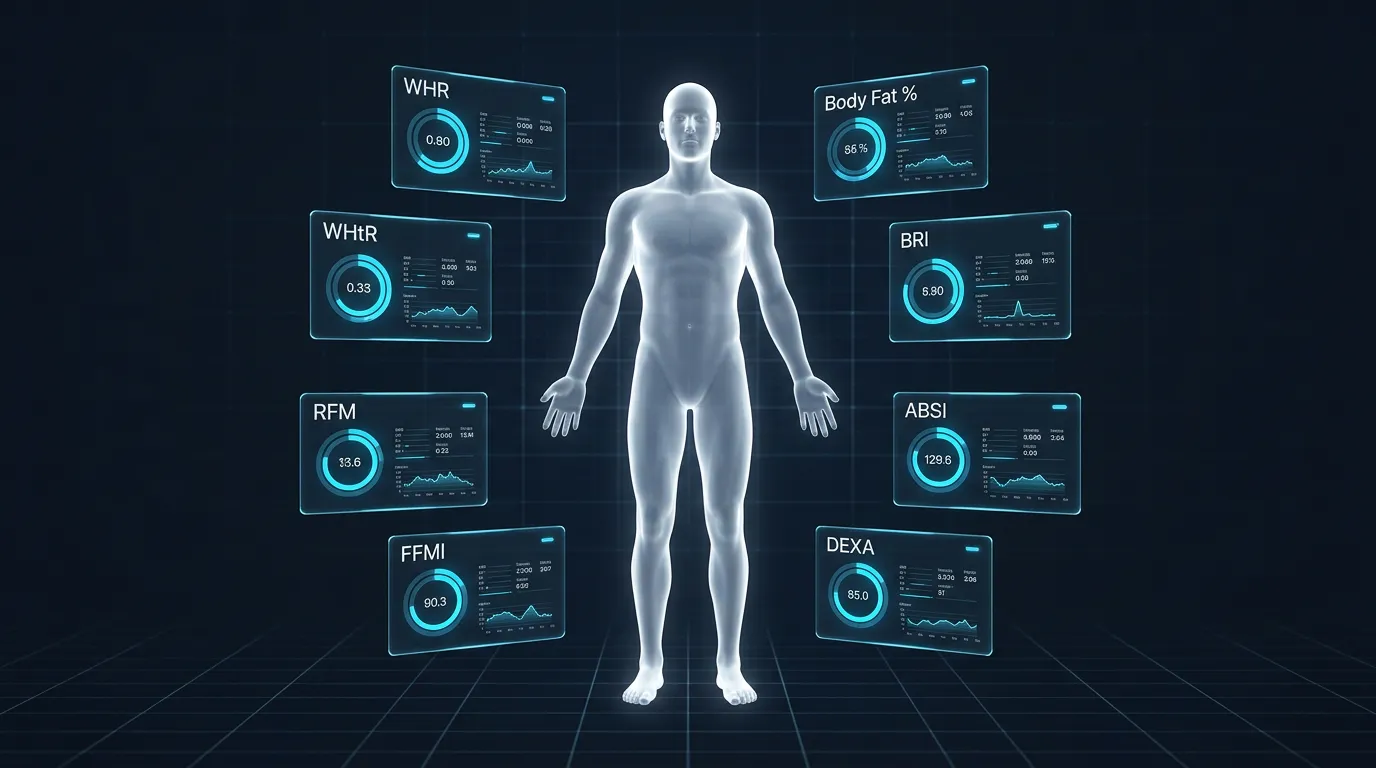
Clinical comparison of eight validated alternatives to Body Mass Index — Waist-to-Hip Ratio, Waist-to-Height Ratio, Body Fat Percentage, Body Roundness Index, Relative Fat Mass, A Body Shape Index, Fat-Free Mass Index, and DEXA. Each metric explained with formula, accuracy data, clinical thresholds, and the population it serves best.
Body Mass Index fails to measure fat distribution, lean mass, visceral adiposity, and metabolic health — the four variables that actually predict disease risk and mortality. Eight clinically validated alternatives address these blind spots. Waist-to-Hip Ratio and Waist-to-Height Ratio quantify central fat distribution with a tape measure. Body Roundness Index and Relative Fat Mass estimate body fat percentage from height and waist circumference. Fat-Free Mass Index measures lean mass for athletic populations. A Body Shape Index isolates abdominal fat from body weight. Body fat percentage via BIA or DEXA provides direct adiposity measurement. The American Medical Association's 2023 Policy H-440.842 and the 2025 Lancet Diabetes & Endocrinology Commission both recommend using BMI alongside these complementary metrics rather than in isolation.
- RFM accuracy: R² = 0.84 against DEXA — versus BMI's R² = 0.36
- WHtR universal threshold: Keep waist circumference below half your height
- BRI mortality optimum: 3.41 to 5.46 (lowest all-cause mortality risk)
- FFMI natural ceiling: 25 kg/m² in drug-free trained males
- WHR cardiovascular thresholds: <0.90 men, <0.85 women
- 2025 mortality study: Body fat >27% (M) / >44% (F) = 78% higher mortality
- AMA Policy H-440.842: June 2023 — formal BMI reform
- Lancet Commission 2025: Endorsed by 75+ medical organizations
01Why BMI Needs Alternatives
BMI calculates weight relative to height but cannot distinguish muscle from fat, visceral from subcutaneous adipose tissue, or healthy weight from metabolically dysfunctional weight. Three institutional milestones formalize this limitation: the AMA's 2023 reform policy, the 2025 Lancet Commission obesity framework, and the 2025 Annals of Family Medicine mortality study demonstrating body fat percentage as a superior mortality predictor.
The Compositional Blind Spot
The Quetelet formula operates on two scalar inputs — mass and height. It cannot capture the variables that actually determine disease risk: visceral fat volume, lean muscle mass, bone density, or fat distribution pattern. Two individuals weighing 85 kg (187 lbs) at 178 cm (5'10") both calculate BMI 26.8 (Overweight). One may carry 14 percent body fat with substantial lean mass. The other may carry 32 percent body fat concentrated as visceral adipose tissue around abdominal organs. BMI treats them as clinically identical.
The AMA's 2023 Policy H-440.842
In June 2023, the American Medical Association adopted Policy H-440.842, formally recognizing BMI as "an imperfect way to measure body fat in multiple groups given that it does not account for differences across race/ethnic groups, sexes, genders, and age-span." The policy recommends BMI be used alongside measures of visceral fat, body composition, relative fat mass, waist circumference, and genetic and metabolic factors. This represents the most significant institutional reform of BMI practice since WHO standardization in 1995.
The 2025 Lancet Commission Framework
The Lancet Diabetes & Endocrinology Commission, published in January 2025 and endorsed by over 75 medical organizations worldwide, introduced a refined obesity diagnosis framework. The Commission separates preclinical obesity (excess body fat without organ dysfunction) from clinical obesity (excess fat with demonstrable organ pathology). The framework explicitly recommends supplementing BMI with additional body fat measures and clinical signs — moving beyond the single-number classification that BMI provides.
Annals of Family Medicine, 2025: Body fat percentage measured by bioelectrical impedance demonstrated a clear dose-response correlation with all-cause mortality. Adults with body fat above 27 percent (male) and 44 percent (female) faced 78 percent higher mortality compared to healthy ranges. BMI failed to predict mortality risk over the same 15-year follow-up period.
02Waist-to-Hip Ratio (WHR) — Fat Distribution Assessment
Waist-to-hip ratio divides waist circumference by hip circumference to quantify central fat distribution. A 2023 study in JAMA Network Open analyzing 387,672 UK participants found WHR had the strongest and most consistent association with all-cause mortality compared to BMI and fat mass index — and was the only adiposity measure unaffected by BMI itself.
The Apple vs Pear Distinction
WHR captures what BMI cannot — the geographic distribution of adipose tissue. An individual with BMI 26 and WHR 0.78 (pear-shaped, gluteofemoral fat distribution) carries substantially lower cardiometabolic risk than someone with identical BMI 26 and WHR 0.96 (apple-shaped, central adiposity). The mechanism is anatomical: visceral fat surrounding abdominal organs produces inflammatory adipokines that drive insulin resistance, while peripheral fat in the hips and thighs remains metabolically inert. WHR detects this distribution pattern; BMI cannot.
WHO Clinical Thresholds
| WHR Range | Men | Women | Cardiovascular Risk |
|---|---|---|---|
| < 0.85 | Low | Low | Healthy distribution |
| 0.85 – 0.89 | Low | Moderate | Borderline (women) |
| 0.90 – 0.99 | Moderate | High | Increased |
| ≥ 1.0 | High | High | Substantially elevated |
The 2023 JAMA Network Open analysis is particularly damaging to BMI's clinical primacy. The researchers concluded that "current WHO recommendations for optimal BMI range are inaccurate across individuals with various body compositions and therefore suboptimal for clinical guidelines." They advocated WHR as the primary clinical measure of adiposity for long-term health outcome prediction.
03Waist-to-Height Ratio (WHtR) — The Simplest Accurate Metric
Waist-to-height ratio below 0.5 indicates low cardiometabolic risk regardless of BMI, age, sex, or ethnicity. A meta-analysis of over 300,000 subjects validated the Ashwell Shape Chart, demonstrating that WHtR outperforms BMI for predicting cardiovascular events, type 2 diabetes, and metabolic syndrome across all demographic groups.
The Cross-Ethnic Universality
WHtR distills central adiposity screening to a single rule: keep your waist circumference below half your height. A person 170 cm (5'7") tall should maintain waist circumference below 85 cm (33.5 inches). A person 180 cm (5'11") should stay below 90 cm (35.4 inches). This threshold applies across sexes, age groups, and ethnicities — a universality that BMI's fixed cutoffs cannot achieve. The United Kingdom's National Institute for Health and Care Excellence (NICE) recommends WHtR alongside waist circumference for routine clinical practice.
WHtR Classification Zones
| WHtR Value | Classification | Clinical Implication |
|---|---|---|
| < 0.4 | Underweight risk | Possible insufficient central mass |
| 0.4 – 0.49 | Healthy | Low cardiometabolic risk |
| 0.5 – 0.59 | Increased risk | Central adiposity — monitor metabolic markers |
| ≥ 0.6 | High risk | Substantially elevated cardiovascular risk |
04Body Fat Percentage — Direct Adiposity Measurement
Body fat percentage directly quantifies the proportion of total body mass composed of adipose tissue — the variable BMI attempts to estimate but cannot measure. The 2025 Annals of Family Medicine study established that body fat percentage, not BMI, reliably predicts all-cause mortality risk over 15-year follow-up.
Measurement Methods Compared
Four clinical methods measure body fat percentage with varying accuracy, cost, and accessibility. The choice depends on clinical context — DEXA for research-grade precision, BIA for accessible trend monitoring, skinfold calipers for trained clinical settings, hydrostatic weighing for laboratory environments.
| Method | Accuracy (vs DEXA) | Cost | Best Use Case |
|---|---|---|---|
| DEXA scan | Reference (±1–2%) | $100–300 | Research, diagnostic precision |
| BIA (smart scales) | ±4–8% | $30–300 | Home trend monitoring |
| Skinfold calipers | ±3–5% (trained operator) | $10–50 | Clinical, gym settings |
| Hydrostatic weighing | ±2–3% | $50–150 | Research validation |
Healthy Body Fat Ranges
| Category | Men | Women |
|---|---|---|
| Essential fat | 2–5% | 10–13% |
| Athletic | 6–13% | 14–20% |
| Fitness | 14–17% | 21–24% |
| Average | 18–24% | 25–31% |
| Obese | > 25% | > 32% |
The critical advantage of body fat percentage over BMI is its ability to identify metabolically obese normal-weight (MONW) individuals — adults with normal BMI but elevated body fat and visceral adiposity. This population comprises 8 to 30 percent of normal-BMI adults depending on ethnicity, developing type 2 diabetes and cardiovascular disease at rates equivalent to clinically obese individuals. BMI screening misses them entirely.
05Body Roundness Index (BRI) — The Trending BMI Replacement
Body Roundness Index quantifies body shape eccentricity using waist circumference and height, providing a mathematical estimate of visceral body fat. Introduced by Thomas et al. in 2013, BRI scores range from 1 to 16. A study of over 30,000 U.S. adults found BRI scores between 3.41 and 5.46 associated with the lowest all-cause mortality risk, following a U-shaped mortality curve.
The Geometric Logic
Thomas et al. introduced BRI in the journal Obesity, modeling the human body as an ellipse to relate waist girth to height. Mathematically, BRI is a reformulation of waist-to-height ratio using eccentricity — borrowed from Johannes Kepler's planetary orbit equations. A score of 1 represents a narrow, elongated body shape. A score of 16 represents extreme roundness. Most adults fall between 1 and 10, with population mean around 5.
BRI Interpretation Ranges
| BRI Score | Body Shape | All-Cause Mortality Risk |
|---|---|---|
| < 3.41 | Very lean (narrow) | 25% higher (U-curve low end) |
| 3.41 – 4.44 | Lean to average | No significant increase |
| 4.45 – 5.45 | Average | Lowest risk (reference) |
| 5.46 – 6.90 | Above average roundness | Elevated risk |
| > 6.91 | High roundness | Up to 49% higher |
BRI vs BMI — A Clinical Comparison
Two individuals with identical BMI 26 may score BRI 3.2 (low risk — narrow waist, weight carried in muscle) and BRI 5.8 (moderate risk — wide waist, weight concentrated abdominally). BMI classifies both as equally Overweight. BRI distinguishes the healthy individual from the at-risk one. This distinction matters clinically because abdominal visceral fat — the type BRI estimates — drives metabolic syndrome, type 2 diabetes, and cardiovascular disease disproportionately to total body weight.
06Relative Fat Mass (RFM) — DEXA-Validated Body Fat Estimation
Relative Fat Mass estimates body fat percentage using only height and waist circumference, with R² = 0.84 accuracy against DEXA — compared to BMI's R² = 0.36. Developed by Woolcott and Bergman at Cedars-Sinai Medical Center in 2018, RFM was derived from over 12,000 NHANES participants and validated against dual-energy X-ray absorptiometry.
Why RFM Beats BMI
RFM offers two structural advantages over BMI. First, RFM incorporates waist circumference as a direct proxy for abdominal fat mass. Second, by excluding body weight entirely, RFM eliminates the muscle mass confound that causes BMI to misclassify athletes. A bodybuilder with BMI 32 and waist 81 cm (32 inches) at 183 cm (6'0") calculates RFM approximately 21 percent — accurately reflecting low body fat — while BMI labels the same individual as Obese Class I.
- Compute the ratio: 180 ÷ 85 = 2.118
- Apply the multiplier: 20 × 2.118 = 42.35
- Subtract from constant: 64 − 42.35 = 21.65
- Add sex adjustment (male = 0): 21.65 + 0 = 21.65%
Accuracy Validation Against DEXA
In the validation dataset of 3,456 NHANES participants, RFM predicted whole-body fat percentage (measured by DEXA) with R² = 0.84 and root mean squared error (RMSE) of 3.51 percent. BMI achieved R² = 0.36 with RMSE of 7.04 percent for the same population. RFM had fewer false-negative cases of body fat-defined obesity among both women and men. External validation studies in Mexican (Guzman-Leon et al., 2019) and Korean (Paek et al., 2019) populations confirmed cross-ethnic accuracy.
| RFM Category | Males | Females |
|---|---|---|
| Healthy | < 25% | < 35% |
| Overweight equivalent | 25–30% | 35–40% |
| Obese (Woolcott & Bergman 2020) | > 30% | > 40% |
07A Body Shape Index (ABSI) — Abdominal Fat Predictor
A Body Shape Index isolates waist circumference from BMI's confounding effect on body weight, providing an independent measure of abdominal adiposity associated with mortality risk. Developed by Krakauer and Krakauer in 2012 using NHANES data, ABSI identifies individuals with disproportionately large waist circumferences relative to their height and weight — a pattern strongly linked to visceral fat accumulation and sarcopenic obesity.
Statistical Independence From BMI
ABSI was specifically designed to be statistically independent from BMI — meaning two individuals with identical BMI can have different ABSI values reflecting different waist circumferences. This independence allows ABSI to capture abdominal fat accumulation that BMI masks. A higher ABSI z-score indicates a larger waist relative to what would be expected for a given height and weight, suggesting visceral adiposity even when overall weight appears normal.
ABSI Z-Score Interpretation
Raw ABSI values are difficult to interpret without population context. The z-score standardization compares an individual's ABSI to the NHANES reference population, adjusted for age and sex. A z-score of zero indicates average abdominal adiposity; positive scores indicate larger-than-average waist circumference; negative scores indicate smaller-than-average.
| ABSI Z-Score | Interpretation | Mortality Association |
|---|---|---|
| < −0.868 | Very low | Below average mortality |
| −0.868 to −0.272 | Low | Below average mortality |
| −0.272 to +0.229 | Average | Population baseline |
| +0.229 to +0.798 | High | Above average mortality |
| > +0.798 | Very high | Substantially elevated |
ABSI demonstrates particular clinical value for detecting sarcopenic obesity — the dangerous combination of muscle loss and visceral fat gain common in aging populations. Research by Gomez-Peralta et al. (2018) confirmed that ABSI independently predicted fat-free mass index in overweight and obese adults with type 2 diabetes, identifying sarcopenic individuals missed by BMI alone.
08Fat-Free Mass Index (FFMI) — The Athlete's Alternative
Fat-Free Mass Index normalizes lean body mass to height squared, providing the only BMI alternative specifically designed for athletes and muscular individuals. FFMI above 25 kg/m² in drug-free males is considered the approximate natural ceiling based on the landmark Kouri et al. (1995) study, making FFMI useful for both body composition assessment and anabolic steroid detection in competitive sports.
Correcting BMI's Failure for Athletes
FFMI corrects the central failure of BMI in athletic populations by measuring lean mass independently. An NFL linebacker with BMI 31 (Obese Class I per WHO) and 12 percent body fat calculates FFMI approximately 24.5 — accurately reflecting an elite muscular physique within natural limits. BMI misclassifies the same individual as obese. FFMI provides the correct clinical assessment.
- Calculate fat-free mass: 95 × (1 − 0.12) = 95 × 0.88 = 83.6 kg
- Square the height: 1.80² = 3.24 m²
- Divide lean mass by squared height: 83.6 ÷ 3.24 = 25.8
- FFMI = 25.8 kg/m² — Superior, near natural ceiling
FFMI Classification Scale (Males)
| FFMI Range | Classification |
|---|---|
| < 18 | Below average muscle mass |
| 18–20 | Average (general population) |
| 20–22 | Above average (recreationally trained) |
| 22–23 | Excellent (well-trained) |
| 23–25 | Superior (natural ceiling range) |
| 25–27 | Suspicious (possible anabolic use) |
| > 27 | Strongly suggests anabolic enhancement |
The Kouri et al. (1995) study analyzed FFMI in 157 male athletes including 83 documented steroid users and 74 non-users. Non-users showed a clear FFMI ceiling around 25 kg/m², while users routinely exceeded 26 kg/m² with some reaching 30+. This research established FFMI 25 as the practical natural limit for drug-free male physiques — useful for athletic governance and naturally trained individuals tracking realistic muscle development goals.
09DEXA Scan — The Clinical Gold Standard
Dual-energy X-ray absorptiometry (DEXA) provides the most precise body composition measurement available, quantifying bone mineral density, lean tissue mass, and fat tissue mass across distinct body regions with 1 to 2 percent error. DEXA serves as the reference standard against which all other body composition methods are validated.
How DEXA Works
DEXA scans direct two X-ray beams at different energy levels through the body. The differential absorption of these beams by bone, lean tissue, and fat tissue allows precise quantification of each component. Unlike BMI, BIA, or skinfold calipers, DEXA provides regional body composition data — trunk fat, arm lean mass, leg fat distribution — enabling identification of asymmetric fat patterns and regional muscle imbalances.
What DEXA Measures That Nothing Else Can
DEXA uniquely quantifies three composition variables in a single 10-minute scan: total body fat percentage with ±1–2% precision, regional fat distribution (trunk vs extremities, android vs gynoid), and bone mineral density (BMD) critical for osteoporosis screening. A 2025 opinion paper in Obesity endorsed AI-enhanced CT body composition analysis as an emerging alternative that provides even more precise tissue differentiation, though at significantly higher cost and radiation exposure than DEXA.
DEXA's limitations are practical, not scientific. Scans cost $100 to $300 per session, require clinical imaging equipment, and involve minimal radiation exposure (approximately 0.001 mSv — less than a transcontinental flight). These barriers prevent DEXA from replacing BMI for population-level screening, despite its superior accuracy. For individuals who can access DEXA, a baseline scan plus annual monitoring provides the most comprehensive longitudinal data available.
10Head-to-Head Comparison Table
No single alternative replaces BMI for all populations and use cases. WHtR offers the best universal screening balance. Body fat percentage and RFM provide the highest accuracy for adiposity assessment. FFMI serves athletes exclusively. DEXA remains the clinical gold standard but lacks population-wide accessibility.
The following matrix evaluates all eight alternatives against six clinical criteria. Each metric addresses specific BMI limitations while introducing its own trade-offs. The optimal approach — endorsed by both the AMA and the 2025 Lancet Commission — combines two to three complementary metrics rather than relying on any single measurement.
| Metric | What It Measures | Inputs | Accuracy vs DEXA | Best For |
|---|---|---|---|---|
| WHR | Fat distribution pattern | Waist, hip | Moderate (r ≈ 0.65) | Cardiovascular risk screening |
| WHtR | Central adiposity vs stature | Waist, height | Good (r ≈ 0.72) | Universal metabolic screening |
| Body Fat % | Adipose tissue percentage | BIA or calipers | Good (BIA ±4–8%) | Fitness tracking |
| BRI | Body shape eccentricity | Waist, height | Good (r ≈ 0.70) | Visceral fat estimation |
| RFM | Body fat percentage | Waist, height, sex | High (R² = 0.84) | Equipment-free fat estimation |
| ABSI | Abdominal fat independent of BMI | Waist, height, weight | Moderate (r ≈ 0.60) | Mortality prediction |
| FFMI | Lean mass per height² | Height, weight, BF% | N/A (lean, not fat) | Athletes, muscular populations |
| DEXA | Bone, fat, lean (regional) | Clinical imaging | Reference (±1–2%) | Research, clinical precision |
11Which Body Composition Metric Should You Use?
Use waist-to-height ratio (WHtR) as your primary screening metric, supplement with body fat percentage for longitudinal tracking, and add a specialized metric for your population. Athletes should add FFMI. Adults over 65 should add ABSI for sarcopenic obesity detection. Individuals concerned about visceral fat should add BRI or RFM. No single metric replaces a comprehensive clinical assessment.
Decision Matrix by Population Profile
| Population | Primary Metric | Secondary Metric | Clinical Rationale |
|---|---|---|---|
| General adult | WHtR | Body fat % | Simple, universal, validated |
| Athlete / muscular | FFMI | WHR | BMI overestimates obesity in muscle |
| Senior (65+) | ABSI | Body fat % + grip strength | Detects sarcopenic obesity |
| Asian population | WHtR | RFM | Cross-ethnic validity |
| Weight loss tracking | Body fat % | WHtR + BRI | Tracks composition, not weight |
| Clinical research | DEXA | ABSI + RFM | Gold standard with validated supplements |
The optimal strategy combines BMI with two to three complementary metrics rather than abandoning BMI entirely. BMI retains clinical utility for population-level screening, insurance eligibility, and longitudinal weight tracking. Its limitations emerge only when used in isolation for individual diagnosis. Supplement BMI with a central adiposity metric (WHtR, WHR, or BRI) and a composition metric (body fat percentage, RFM, or FFMI) for clinically actionable assessment.

Build Your Body Composition Profile
VisualBody Lab provides free clinical calculators for the body composition metrics that BMI cannot measure. Combine WHR, body fat percentage, and BMI for a complete assessment that aligns with current AMA and Lancet Commission recommendations.
Start with the Clinical BMI CalculatorFrequently Asked Questions
DEXA scanning is the most accurate body composition method, with 1 to 2 percent error against true tissue values. For accessible alternatives requiring only a tape measure, Relative Fat Mass (RFM) achieves R² = 0.84 against DEXA — more than double BMI's R² = 0.36. Waist-to-height ratio offers the best balance of simplicity and predictive validity for general population screening.
BRI is a body shape metric introduced by Thomas et al. in 2013 that estimates visceral body fat using waist circumference and height. The formula models the body as an ellipse using mathematical eccentricity borrowed from Kepler's planetary orbit equations. BRI scores range from 1 to 16, with values between 3.41 and 5.46 associated with lowest all-cause mortality risk in a study of over 30,000 U.S. adults.
BMI systematically overestimates body fat in athletes because it cannot distinguish muscle from adipose tissue. NFL linebackers average BMI 31 (Obese Class I) while carrying only 10 to 14 percent body fat. Rugby forwards measure BMI 32 to 35 with body fat 12 to 18 percent. Fat-Free Mass Index (FFMI) is the recommended alternative for athletes, normalizing lean body mass to height without the fat mass confound.
Waist-to-height ratio (WHtR) and waist-to-hip ratio (WHR) directly measure central adiposity that BMI ignores. Keep your waist circumference below half your height (WHtR < 0.5) for lowest cardiometabolic risk. Body Roundness Index (BRI) and Relative Fat Mass (RFM) provide additional visceral fat estimation using the same tape-measure inputs. None of these alternatives require equipment beyond a tape measure.
The American Medical Association adopted Policy H-440.842 in June 2023, formally recognizing BMI as imperfect and recommending contextual use alongside complementary metrics. The policy specifically cites BMI's failure to account for differences across race, ethnicity, sex, gender, and age. The AMA recommends supplementing BMI with waist circumference, body composition, relative fat mass, visceral fat, and metabolic factors — representing the most significant institutional reform of BMI practice since WHO standardization in 1995.
RFM predicts whole-body fat percentage with R² = 0.84 against DEXA, compared to BMI's R² = 0.36 — more than double the accuracy. Developed by Woolcott and Bergman at Cedars-Sinai in 2018 using 12,581 NHANES participants, RFM uses only height and waist circumference. By excluding body weight from its formula, RFM eliminates the muscle mass confound that makes BMI unreliable for athletic and muscular individuals.
WHtR below 0.5 indicates low cardiometabolic risk across all demographic groups, making it a strong candidate for universal screening. The Ashwell Shape Chart, validated across 300,000+ subjects, demonstrates WHtR outperforms BMI for predicting cardiovascular events and metabolic syndrome. The UK's NICE guidelines already recommend WHtR alongside waist circumference for clinical practice. Several countries have adopted WHtR as a preferred screening guideline.
Based on Scientific Sources
- Thomas DM, Bredlau C, Bosy-Westphal A, et al. Relationships between body roundness with body fat and visceral adipose tissue emerging from a new geometrical model. Obesity (Silver Spring); 2013;21(11):2264-2271. → PubMed
- Woolcott OO, Bergman RN. Relative fat mass (RFM) as a new estimator of whole-body fat percentage. Scientific Reports; 2018;8:10980. → Nature
- Krakauer NY, Krakauer JC. A new body shape index predicts mortality hazard independently of body mass index. PLoS ONE; 2012;7(7):e39504. → PubMed
- Kouri EM, Pope HG Jr, Katz DL, Oliva P. Fat-free mass index in users and nonusers of anabolic-androgenic steroids. Clinical Journal of Sport Medicine; 1995;5(4):223-228. → PubMed
- Ashwell M, Gunn P, Gibson S. Waist-to-height ratio is a better screening tool than waist circumference and BMI for adult cardiometabolic risk factors. Obesity Reviews; 2012;13(3):275-286. → PubMed
- Rubino F, Cummings DE, Eckel RH, et al. Definition and diagnostic criteria of clinical obesity. The Lancet Diabetes & Endocrinology; 2025. → Lancet