BMI Formula: How to Calculate Body Mass Index (Math + History)
Complete mathematical derivation of the BMI formula with Adolphe Quetelet’s 1832 origin story, metric and imperial calculations, three worked clinical examples, and the common calculation mistakes that distort results.
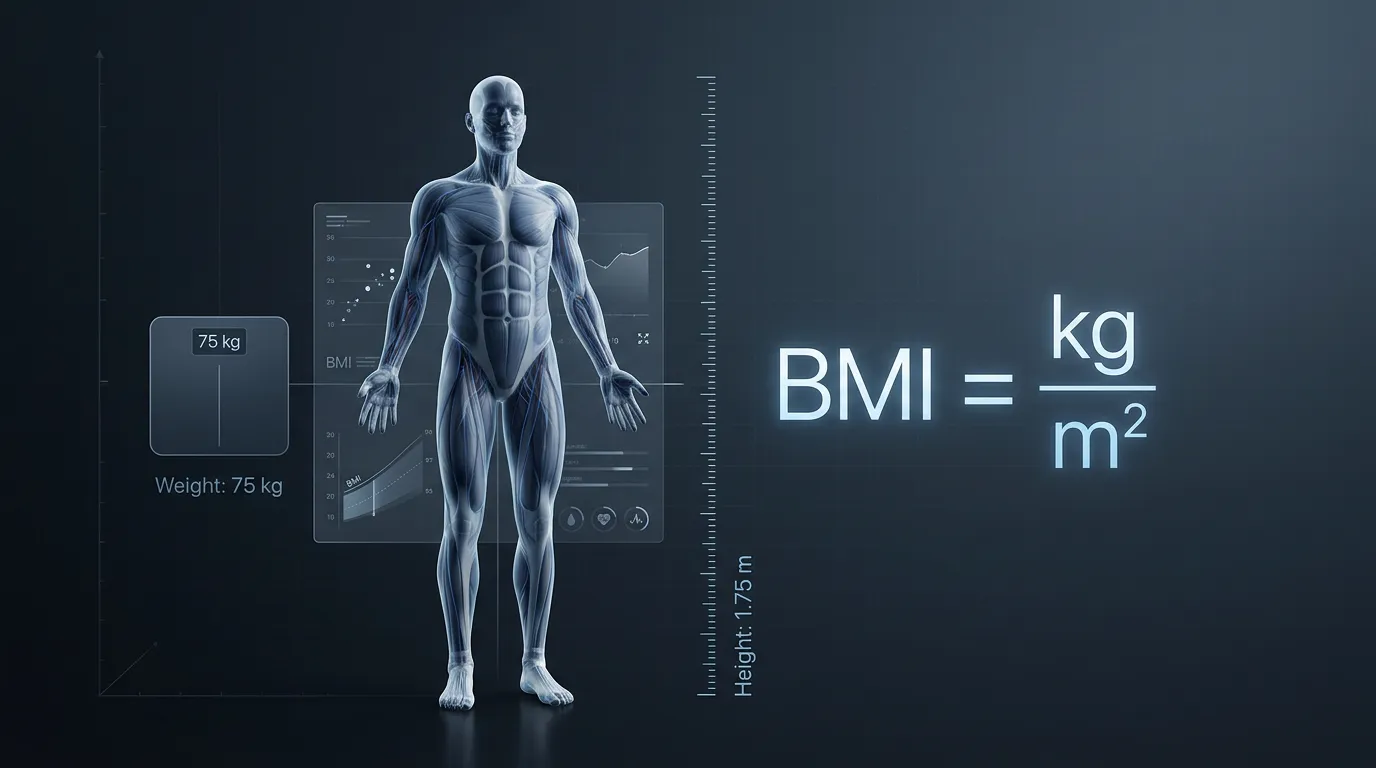
The BMI formula divides body weight in kilograms by the square of standing height in meters (kg/m²). For imperial units, multiply pounds divided by inches squared by the conversion factor 703. Belgian statistician Adolphe Quetelet developed the formula in 1832 for population demographics — not individual diagnosis. American physiologist Ancel Keys renamed it “Body Mass Index” in his 1972 Journal of Chronic Diseases paper, and the WHO formalized clinical cutoffs in 1995.
- Metric formula: BMI = weight (kg) ÷ height (m)²
- Imperial formula: BMI = [weight (lb) ÷ height (in)²] × 703
- Origin: Adolphe Quetelet, 1832, Belgium
- Renaming: Ancel Keys, 1972, Journal of Chronic Diseases
- WHO standardization: 1995 — global clinical cutoffs adopted
- Result type: Dimensionless number (kg/m² × m²/kg = 1)
- Conversion factor 703: 2.20462 × 39.3701² ≈ 703
- WHO Normal range: 18.5 to 24.9 kg/m²
01The Mathematical Formula
BMI is calculated by dividing body weight in kilograms by the square of standing height in meters. The mathematical operation is straightforward: measure body mass and stature, square the height value, then divide weight by the result. The output is a dimensionless number — typically between 15 and 50 for adult human populations.
Metric Formula (Standard)
The standard international BMI formula uses metric units. Body weight is expressed in kilograms (kg) and height in meters (m). The denominator squares the height value, producing units of square meters (m²). The complete formula reads:
A practical example: an adult weighing 70 kg (154 lbs) at 1.75 meters (5’9″) tall calculates BMI as 70 ÷ (1.75 × 1.75) = 70 ÷ 3.0625 = 22.86 kg/m². This value falls within the WHO Normal Weight classification range of 18.5 to 24.9.
Imperial Formula (US Standard)
Healthcare systems in the United States typically use imperial units — pounds for weight and inches for height. The imperial formula requires a conversion factor to maintain numerical equivalence with metric calculations:
The same individual measured in imperial units — 154 lb at 69 inches tall — calculates BMI as (154 ÷ 69²) × 703 = (154 ÷ 4761) × 703 = 0.03235 × 703 = 22.74. The minor discrepancy from the metric calculation (22.86 vs 22.74) reflects rounding in unit conversions.
Output Interpretation
The numerical result of either formula corresponds to standardized weight category thresholds established by the World Health Organization in 1995:
| BMI Range | WHO Classification |
|---|---|
| < 18.5 | Underweight |
| 18.5 – 24.9 | Normal Weight |
| 25.0 – 29.9 | Overweight |
| 30.0 – 34.9 | Obese Class I |
| 35.0 – 39.9 | Obese Class II |
| ≥ 40.0 | Obese Class III |
02Historical Origin — Adolphe Quetelet (1832)
Belgian statistician Adolphe Quetelet developed what became known as BMI in 1832, originally calling it the “Quetelet Index.” Quetelet published the formula as part of his work on social physics — the statistical analysis of human populations. Crucially, he designed the index for demographic comparison, not individual health diagnosis, and explicitly warned against applying it to individual cases.

Who Was Adolphe Quetelet?
Lambert Adolphe Jacques Quetelet (1796-1874) was a Belgian astronomer, mathematician, statistician, and sociologist. Trained at the University of Ghent and the Paris Observatory, Quetelet pioneered the application of statistical methods to human populations — a field he termed physique sociale (social physics). His work established the foundations of modern demographic research and biostatistics.
Quetelet was obsessed with finding mathematical regularities in human characteristics. He developed the concept of l’homme moyen (the average man), a statistical archetype representing population norms across physical, intellectual, and moral dimensions. The Quetelet Index emerged from this broader project to quantify the average human form.
The 1832 Publication
Quetelet’s foundational paper “Sur l’homme et le développement de ses facultés, ou Essai de physique sociale” (1832) established what would become BMI. He analyzed body measurements from European populations and tested various mathematical relationships between weight and height. After comparing weight scaling against multiple height exponents — h, h², h³ — Quetelet observed that weight correlated most consistently with the square of height in adult populations.
The original formulation in Quetelet’s notation differed slightly from modern BMI, but the mathematical structure remained identical: total body weight divided by stature squared. Quetelet derived this relationship empirically from population data, not theoretical biological principles.
Quetelet’s Own Warning
The most consequential aspect of Quetelet’s original work is the warning he embedded — and that the medical community subsequently ignored for nearly two centuries. Quetelet specifically cautioned that his index applied to population averages, not individual diagnosis. He noted that variations in muscle, bone, and overall composition would distort individual readings, making the formula unsuitable as a personal health metric.
Quetelet’s 1832 caveat: The index was designed to describe the average body proportions of large populations for demographic and actuarial purposes. Individual variation from the population average — common in athletes, the elderly, and ethnically distinct groups — fell outside the formula’s intended scope.
Renaming to BMI (1972)
The Quetelet Index remained an obscure statistical tool for 140 years until American physiologist Ancel Keys revived it. In his landmark 1972 paper “Indices of relative weight and obesity” published in the Journal of Chronic Diseases, Keys evaluated various body weight indices against actual body composition data. He concluded that Quetelet’s formula performed best among simple ratios and renamed it “Body Mass Index” — the term used today.
Keys’s paper triggered widespread clinical adoption. The World Health Organization formally standardized BMI cutoffs in 1995, creating the now-familiar categories (Underweight, Normal, Overweight, Obese) that anchor global obesity surveillance. From a 19th-century demographic curiosity to a 21st-century clinical screening standard — the trajectory took 163 years.
03Why Height Is Squared (Not Cubed)
Height is squared in the BMI formula because empirical population data showed body weight scales approximately as height² in adult humans, not linearly and not cubically. Quetelet tested multiple exponents against real population measurements and found h² produced the strongest correlation. This is an empirical finding, not a theoretical biological principle.
The Geometric Intuition
If humans were perfectly proportional three-dimensional objects, body weight would scale as height cubed (h³) — since volume scales as the cube of any linear dimension. A person twice as tall as another, geometrically scaled, would weigh eight times as much (2³ = 8). However, real human bodies do not maintain isometric proportions across heights.
Taller adults are not simply scaled-up versions of shorter adults. Their cross-sectional dimensions (limb circumference, torso width) do not increase proportionally with stature. Bone and muscle volume scales less aggressively than pure geometric prediction would suggest. The result: weight increases more slowly than h³ would predict but faster than h¹ (linear) would predict.
The Empirical Decision
Quetelet did not derive the squared exponent from biological theory. He tested the relationship statistically against population measurement data and selected the exponent producing the highest correlation coefficient. For adult European populations, h² produced approximately 0.7 to 0.8 correlation with body weight — substantially better than either linear or cubic scaling.
This empirical foundation creates one of BMI’s persistent vulnerabilities. The h² exponent fits average adult populations reasonably well but performs poorly for outliers — exceptionally tall individuals, children whose proportions differ developmentally, and athletes whose muscle mass deviates from population norms. The formula’s mathematical structure assumes a “standard” adult body that not everyone matches.
Alternative Indices Proposed
Researchers have proposed alternative indices to address BMI’s limitations. The Ponderal Index (weight/height³) better captures very tall individuals. The Body Adiposity Index (BAI) incorporates hip circumference rather than height alone. The Surface-based Body Shape Index (SBSI) adjusts for both height and waist circumference. None has achieved BMI’s institutional adoption, despite measurable accuracy advantages in specific populations.
04Three Worked Examples
Calculating BMI takes three operations: square the height, divide weight by the squared height, then interpret against WHO categories. The following three worked examples demonstrate the calculation for distinct demographic profiles — each illustrating both the formula’s mechanics and its interpretive nuances.

- Square the height: 1.78 × 1.78 = 3.1684 m²
- Divide weight by squared height: 82 ÷ 3.1684 = 25.88
- Round to one decimal: BMI = 25.9 kg/m²
- WHO classification: Overweight (25.0 to 29.9)
The athletic male example illustrates BMI’s primary failure mode — the Athlete Paradox. A 82 kg male at 1.78 m with substantial muscle mass calculates as Overweight despite carrying minimal adipose tissue. The formula cannot distinguish lean mass from fat mass, producing misleading classification for muscular individuals.
- Square the height: 1.65 × 1.65 = 2.7225 m²
- Divide weight by squared height: 62 ÷ 2.7225 = 22.77
- Round to one decimal: BMI = 22.8 kg/m²
- WHO classification: Normal Weight (18.5 to 24.9)
The average female example represents the formula’s intended use case. A 62 kg female at 1.65 m calculates a BMI of 22.8 — squarely within the Normal Weight range and aligned with the BMI 22 to 24 mortality optimum identified in the Global BMI Mortality Collaboration’s 2016 Lancet meta-analysis of 10.6 million participants.
- Square the height: 1.72 × 1.72 = 2.9584 m²
- Divide weight by squared height: 68 ÷ 2.9584 = 22.98
- Round to one decimal: BMI = 23.0 kg/m²
- WHO classification: Normal Weight (18.5 to 24.9)
The senior male example demonstrates BMI’s blindness to body composition changes with aging. A 72-year-old male calculating BMI 23 may carry 28 to 32 percent body fat due to age-related sarcopenia — qualifying as obese by composition while appearing Normal Weight by BMI. The formula’s mathematical structure cannot detect this clinically significant pattern.
05Metric vs Imperial — Why the Conversion Factor 703?
The 703 conversion factor in the imperial BMI formula reconciles unit differences between pounds-inches and kilograms-meters. Without this factor, an imperial BMI calculation would produce a numerically tiny value incompatible with WHO classification thresholds. The 703 derives from squaring the inches-to-meters conversion (39.3701²) and multiplying by the pounds-to-kilograms ratio (2.20462).
Deriving the 703 Factor
To convert imperial BMI to metric-equivalent values, two unit conversions must occur. Weight in pounds must convert to kilograms (1 kg = 2.20462 lb). Height in inches must convert to meters (1 m = 39.3701 inches). Because the formula squares height, the inches-to-meters conversion factor must be squared as well.
The factor 703 (sometimes 703.07 for higher precision) makes the imperial formula numerically equivalent to the metric formula. Using this conversion, a person with metric BMI 22.86 will produce imperial BMI 22.86 (within rounding tolerance). Without the conversion, imperial calculation would yield approximately 0.0325 — a number with no clinical meaning.
Practical Conversion Reference
| Step | Metric Calculation | Imperial Calculation |
|---|---|---|
| Input | 70 kg, 1.75 m | 154 lb, 69 inches |
| Square height | 1.75² = 3.0625 m² | 69² = 4761 in² |
| Divide | 70 ÷ 3.0625 = 22.86 | 154 ÷ 4761 = 0.03235 |
| Apply factor | (none needed) | 0.03235 × 703 = 22.74 |
| Final BMI | 22.86 kg/m² | 22.74 |
The minor discrepancy between metric (22.86) and imperial (22.74) results reflects rounding in the unit conversions, not formula error. For clinical purposes, both values produce identical WHO classification — Normal Weight.
06Common Calculation Mistakes
Five recurring errors distort BMI calculations: forgetting to square the height, using centimeters instead of meters, mixing imperial and metric units, applying the wrong conversion factor, and rounding intermediate values prematurely. Each can produce results dramatically different from the correct value.
Mistake 1: Using Centimeters Instead of Meters
The metric formula requires height in meters, not centimeters. A 175 cm individual must enter 1.75 m, not 175. Using centimeters produces vastly wrong results: 70 ÷ 175² = 70 ÷ 30,625 = 0.00229 — a meaningless value. Always convert centimeters to meters by dividing by 100.
Mistake 2: Forgetting to Square the Height
Some calculators omit the squaring operation, dividing weight by height directly. For 70 kg at 1.75 m, this would produce 70 ÷ 1.75 = 40 — falsely indicating severe obesity. The squaring of height is mathematically essential, not optional.
Mistake 3: Mixing Imperial and Metric Units
Combining pounds with meters (or kilograms with inches) without proper conversion produces nonsense values. The formula requires consistent units within either metric or imperial systems. Mixed-unit calculations rank among the most common online calculator errors.
Mistake 4: Wrong Conversion Factor
Imperial BMI requires the 703 conversion factor — not 700, 705, or any other approximation. Using incorrect factors produces results that shift WHO category boundaries by 1 to 2 points. For borderline cases (BMI 24.5 to 25.5), this can change clinical classification from Normal to Overweight.
Mistake 5: Premature Rounding
Rounding intermediate values during calculation introduces cumulative error. Maintain full decimal precision through all calculation steps, then round only the final BMI value. Premature rounding of height² (3.0625 → 3.06) or pre-final BMI (22.857 → 22.9) can shift category placement near threshold boundaries.
07Mathematical Limitations of the Formula
The BMI formula has fundamental mathematical limitations that no amount of careful calculation can correct. The formula treats body weight as a single homogeneous mass — it cannot distinguish muscle from fat, bone from organ tissue, or hydration from adipose accumulation. These limitations are structural to the math itself, not artifacts of measurement error.
Composition Blindness
The Quetelet formula operates exclusively on two scalar inputs: mass and height. It cannot capture body composition variables that determine actual health risk — visceral fat percentage, lean muscle mass, bone density, or hydration status. Two adults with identical BMI may present dramatically different metabolic profiles. The formula’s mathematical structure precludes composition assessment.
The h² Approximation
The squared height denominator works reasonably for average adult populations but fails at extremes. Very tall individuals (over 6’4″) tend to be misclassified upward (BMI overestimated) because human bodies don’t perfectly maintain h² scaling at extreme stature. Very short adults face the opposite bias. Children require completely different formula parameters via age-specific percentile charts.
Population vs Individual Validity
BMI was designed for population-level analysis — the formula’s mathematical structure works adequately when averaged across large groups but fails at the individual level. Quetelet himself warned against individual application. The formula correlates 0.7 to 0.8 with body fat at population scale but only 0.4 to 0.6 for individual prediction. Clinical use of BMI for personal diagnosis violates the formula’s original epistemological scope.

Skip the Manual Calculation — Use the Clinical Calculator
VisualBody Lab’s BMI calculator handles metric and imperial units, applies Asian-adjusted thresholds where appropriate, and presents results alongside complementary body composition metrics like waist-to-hip ratio and body fat percentage.
Calculate BMI in ContextFrequently Asked Questions
The BMI formula divides body weight in kilograms by the square of standing height in meters: BMI = weight (kg) ÷ [height (m)]². For imperial units, the formula is BMI = [weight (lb) ÷ height (in)²] × 703. The result is a dimensionless number used for weight category classification per WHO standards.
Belgian statistician and mathematician Adolphe Quetelet developed the formula in 1832 as part of his work on social physics. Originally called the Quetelet Index, it was renamed Body Mass Index by American physiologist Ancel Keys in his 1972 paper published in the Journal of Chronic Diseases. The World Health Organization formally standardized clinical cutoffs in 1995.
Height is squared because empirical data showed body weight scales approximately as height squared in adult populations, not linearly. Quetelet tested multiple exponents (h, h², h³) against population data and found h² produced the best correlation with weight in healthy adults. The squared denominator normalizes weight across different heights for population comparisons. This is an empirical finding from statistics, not a theoretical biological principle.
To calculate BMI using imperial units: divide weight in pounds by height in inches squared, then multiply by 703. Example: a person weighing 160 lb at 5’10” (70 inches) calculates 160 ÷ (70 × 70) × 703 = 160 ÷ 4900 × 703 = 22.96. The 703 conversion factor accounts for the unit difference between metric and imperial systems.
The number 703 is a conversion factor that allows the imperial unit formula to produce the same numerical result as the metric formula. It derives from converting kilograms to pounds (2.20462) and meters to inches (39.3701 squared), producing the ratio 39.3701² ÷ 2.20462 ≈ 703. Without this factor, imperial BMI would produce vastly different numerical values incompatible with WHO classification thresholds.
The BMI formula calculates the correct mathematical ratio, but the resulting number has significant interpretive limitations. The formula cannot distinguish muscle from fat, bone density from visceral adiposity, or hydration from tissue mass. It performs adequately for population-level analysis (correlation 0.7-0.8 with body fat) but poorly for individual diagnosis. The AMA 2023 Policy H-440.842 recommends contextual use alongside waist circumference and body composition measures.
Based on Scientific Sources
- Quetelet A. Sur l’homme et le développement de ses facultés, ou Essai de physique sociale; 1832. Bachelier, Paris.
- Keys A, et al. Indices of relative weight and obesity. Journal of Chronic Diseases; 1972;25(6):329-343. → PubMed
- World Health Organization. Physical status: the use and interpretation of anthropometry. WHO Technical Report Series 854; 1995. → WHO
- Eknoyan G. Adolphe Quetelet (1796-1874) — the average man and indices of obesity. Nephrology Dialysis Transplantation; 2008;23(1):47-51. → PubMed
- Nuttall FQ. Body Mass Index: Obesity, BMI, and Health: A Critical Review. Nutrition Today; 2015;50(3):117-128. → PubMed
- Global BMI Mortality Collaboration. Body-mass index and all-cause mortality. The Lancet; 2016;388(10046):776-786. → PubMed