BMI Limitations: Why This Number Misleads You (Clinical Critique)
An evidence-based analysis of 8 documented clinical limitations of Body Mass Index — from the Athlete Paradox to the AMA’s 2023 reform. Why a 190-year-old statistical tool deserves contextual interpretation, not blind trust.
Body Mass Index (BMI) has 8 documented clinical limitations that systematically misclassify athletes, seniors, ethnic populations, and metabolically obese normal-weight individuals. In 2023, the American Medical Association adopted Policy H-440.842 formally recognizing these flaws and recommending BMI be used contextually alongside waist circumference and body composition analysis — the most significant institutional reform since WHO standardization in 1995.
- AMA 2023 Policy H-440.842: BMI should be used contextually, not as standalone diagnostic
- MONW prevalence: 8 to 30 percent of normal-BMI adults have metabolic dysfunction
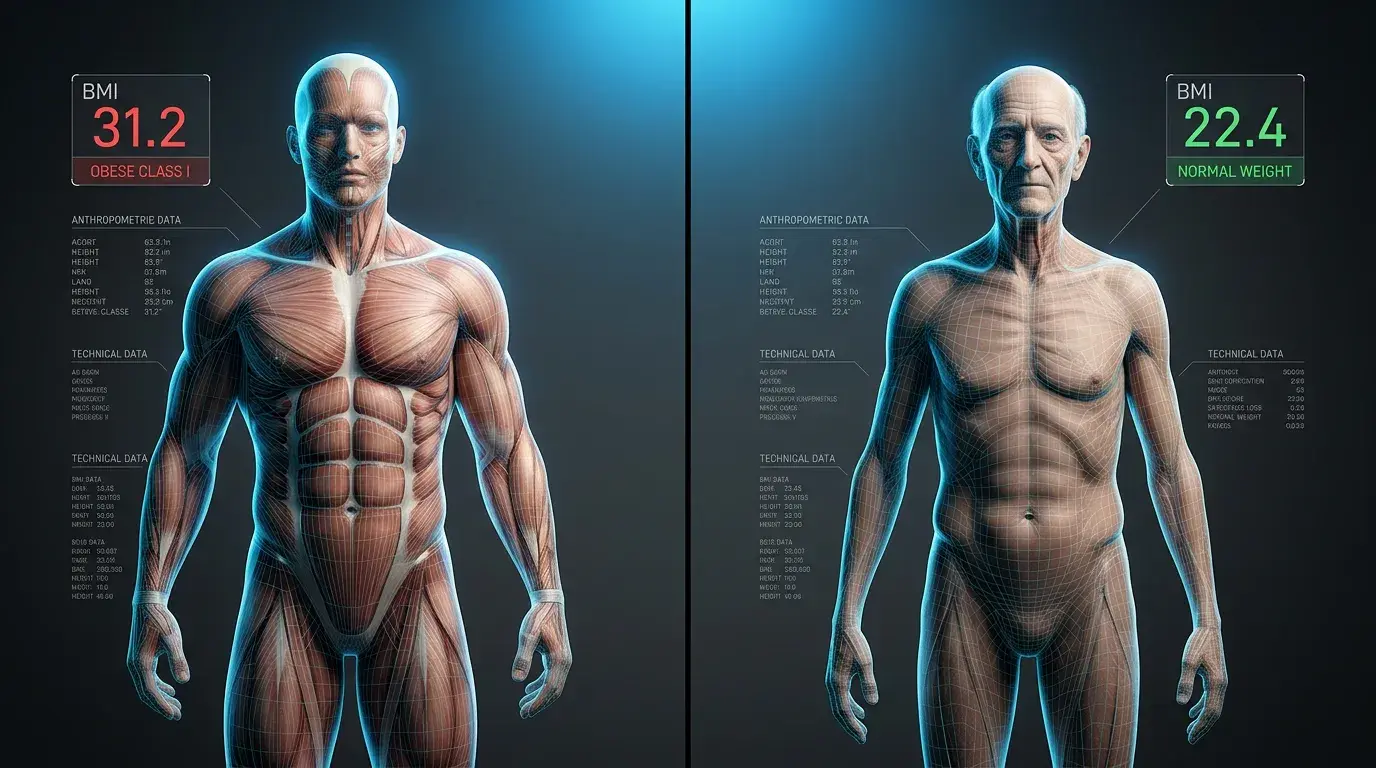
- NFL linebackers: Average BMI 31 (Obese Class I), body fat 10 to 14 percent
- Asian-adjusted thresholds: Overweight ≥23.0, Obese ≥27.5 (vs. Western 25/30)
- Lancet 2016 mortality data: Lowest mortality at BMI 20 to 25 (n=10.6M participants)
- Quetelet’s 1832 warning: Original creator explicitly opposed individual use
What Are the Documented Limitations of BMI?
BMI has 8 documented clinical limitations recognized by major medical institutions including the WHO, AMA, American College of Sports Medicine, and the American Society for Metabolic and Bariatric Surgery. These limitations stem from a fundamental mathematical constraint: BMI is a simple ratio of mass to height squared, ignoring body composition, fat distribution, and individual metabolic variability.
The Quetelet Index has served as the global anthropometric standard for 31 years since the WHO formalized its use in 1995. Across that period, evidence has accumulated demonstrating that BMI systematically misclassifies specific populations — athletes appear “obese,” sarcopenic seniors appear “healthy,” metabolically dysfunctional adults appear “normal,” and ethnic populations require different cutoff points for equivalent disease risk.
This article presents each limitation with specific clinical data, named studies, and validated alternative metrics. The goal is balanced critique: BMI retains utility for large-scale screening, surgery eligibility, and longitudinal tracking, but its limitations must inform interpretation. The American Medical Association’s 2023 reform represents institutional acknowledgment of this reality.
01BMI Cannot Measure Body Composition
BMI cannot differentiate between adipose tissue, lean muscle mass, bone density, or hydration status. This single mathematical ratio fails to capture the qualitative composition of body mass — the foundational limitation from which most other clinical problems derive.
The Mathematical Blind Spot
The Quetelet formula divides total body weight in kilograms by the square of standing height in meters, producing a dimensionless scalar value. Two adults with identical BMI 24.2 may present radically different body compositions: one carrying 12 percent body fat with substantial lean muscle mass, the other carrying 28 percent body fat with minimal muscle. The formula treats them as equivalent because it operates exclusively on mass and height — never tissue density or composition.
Density Differences That BMI Misses
Muscle tissue density exceeds adipose tissue density by approximately 18 percent. Skeletal muscle measures 1.06 g/cm³, while adipose tissue measures 0.9 g/cm³. Bone tissue varies between 1.30 and 1.80 g/cm³ depending on age and mineralization status. Hydration affects total body weight by 1 to 3 percent across normal daily fluctuations. These compositional variables drive substantial weight differences that BMI cannot distinguish from increased body fat.
What This Means in Practice
Two individuals weighing 70 kg (154 lbs) at 170 cm (5’7″) height both calculate BMI 24.2 — squarely in the WHO “Normal Weight” classification. Yet their clinical health profiles diverge entirely:

- Subject A (athletic): 12% body fat, 8.4 kg adipose mass, 61.6 kg lean mass, minimal visceral fat, optimal insulin sensitivity, low cardiovascular risk
- Subject B (sedentary): 28% body fat, 19.6 kg adipose mass, 50.4 kg lean mass, elevated visceral fat, insulin resistance, moderate cardiovascular risk
BMI provides identical classification for two metabolically distinct individuals. This is not theoretical — it is the foundational failure mode from which limitations 2 through 4 directly emerge.
02The Athlete Paradox
BMI systematically overestimates body fat in athletes because muscle tissue density exceeds adipose tissue density by 18 percent. Strength athletes, powerlifters, rugby players, and combat sport competitors routinely register as Overweight or Obese despite low body fat percentages and elite metabolic health.
When Elite Athletes “Become Obese” by BMI
Professional athletes provide the clearest demonstration of BMI’s failure mode. National Football League linebackers average BMI 31 (Obesity Class I per WHO standards) while carrying only 10 to 14 percent body fat — a composition associated with elite athletic performance and minimal cardiovascular risk. Rugby Union forwards measure BMI 32 to 35 with body fat between 12 and 18 percent. Olympic weightlifters in heavier categories exceed BMI 35 while maintaining 8 to 12 percent body fat.

Athletic BMI Misclassification — Real Population Data
The Mathematical Trap
The height-squared denominator in the Quetelet formula was designed to normalize weight across stature, but it fails to account for muscle hypertrophy. When an athlete increases lean mass through resistance training, weight rises while height remains constant — driving BMI upward despite improved metabolic health. The formula treats added kilograms as adipose tissue regardless of actual composition.
FFMI as Better Alternative
The Fat-Free Mass Index (FFMI) normalizes lean body mass to height squared, providing a body composition metric that accurately captures muscularity without the fat mass confound. Calculated as fat-free mass in kilograms divided by height in meters squared, FFMI corrects for the central failure of BMI in athletic populations.
- FFMI 18-20: Average untrained male
- FFMI 20-22: Recreationally trained
- FFMI 23-25: Natural ceiling for drug-free trained males
- FFMI 25-28: Possible with extensive training
- FFMI 28+: Strongly suggests anabolic steroid use
ACSM Position: The American College of Sports Medicine recommends that BMI not be used in isolation for athletes or muscular individuals. Body fat percentage measurement via skinfold calipers, hydrostatic weighing, or DEXA scan provides clinically actionable data where BMI fails.
03Sarcopenic Obesity in Seniors
Adults over 65 with normal BMI may carry dangerously high body fat due to age-related sarcopenia masking visceral adiposity. Muscle atrophy reduces total body weight while fat mass increases or remains constant — creating a “healthy” BMI score that conceals elevated cardiometabolic and frailty risk.
How Aging Tricks the BMI Formula
Skeletal muscle mass declines by 0.5 to 1 percent annually after age 30, accelerating to 1 to 2 percent annually after 60. Bone mineral density similarly declines, particularly in postmenopausal women. Combined, these changes reduce total body weight without corresponding reduction in adipose tissue. A 70-year-old who weighs the same as they did at 40 has likely lost 5 to 10 kg of muscle while gaining equivalent fat mass — invisible to BMI screening.
The Hidden Health Risk
A 70-year-old male with BMI 23 may actually carry 30 percent body fat, qualifying as obese by body composition while appearing “Normal Weight” by BMI. The clinical consequences of sarcopenic obesity exceed those of simple obesity: triple the risk of cardiovascular events, doubled risk of type 2 diabetes, accelerated cognitive decline, increased fall and fracture risk, and reduced surgical outcomes.

EWGSOP2 Clinical Recommendations
The European Working Group on Sarcopenia in Older People (EWGSOP2, 2019) established consensus diagnostic criteria that supplement BMI assessment in adults over 65. Three measurements identify sarcopenic obesity that BMI alone misses:
- Grip strength: Below 27 kg for men, below 16 kg for women indicates probable sarcopenia
- Gait speed: Below 0.8 m/s over 4 meters indicates functional decline
- Chair stand test: More than 15 seconds for 5 repetitions indicates muscle weakness
For seniors with normal BMI but reduced grip strength or gait speed, body composition assessment via DEXA or bioelectrical impedance analysis becomes clinically essential.
04Metabolically Obese Normal Weight (MONW)
Approximately 8 to 30 percent of normal-BMI adults exhibit metabolic dysfunction characteristic of obesity — elevated visceral fat, insulin resistance, dyslipidemia, and hypertension. This phenomenon, termed Metabolically Obese Normal Weight (MONW), escapes BMI detection entirely while carrying type 2 diabetes risk equivalent to clinically obese individuals.
The Hidden Pandemic
MONW prevalence varies dramatically by population. Studies in Western European cohorts report 8 to 18 percent prevalence among normal-BMI adults. Asian populations show substantially higher rates: 30 percent of normal-BMI Chinese adults exhibit metabolic syndrome markers, and 24 to 28 percent of Indian adults with BMI under 23 carry diabetic-equivalent insulin resistance. These individuals appear “healthy” by BMI while developing the same chronic disease trajectory as visibly obese patients.
How MONW Develops
MONW results from preferential visceral fat accumulation without corresponding subcutaneous fat expansion. Genetic predisposition determines fat distribution patterns — some individuals deposit excess energy as visceral (intra-abdominal) fat while maintaining slender subcutaneous tissue and limb circumference. Combined with sedentary lifestyles and high refined-carbohydrate intake, this body type develops insulin resistance and inflammation while remaining lean by BMI standards.

Detection Methods Beyond BMI
Four clinical markers identify MONW more reliably than BMI:
- Waist-to-Height Ratio (WHtR): Above 0.5 indicates central adiposity regardless of BMI
- Fasting insulin: Above 10 µIU/mL suggests insulin resistance even at normal BMI
- HOMA-IR: Homeostatic Model Assessment values above 2.5 confirm insulin resistance
- Triglyceride-to-HDL ratio: Above 3.0 (mg/dL) indicates atherogenic dyslipidemia
The clinical implication is significant: normal-BMI adults reporting central obesity, fatigue, brain fog, or family history of type 2 diabetes warrant metabolic screening regardless of weight classification.
05Ethnic and Racial Variability
BMI thresholds developed from white European populations systematically misclassify Asian, Black, Hispanic, and Pacific Islander populations. Equivalent disease risk occurs at different BMI values across ethnic groups, requiring population-specific cutoff points for accurate clinical screening.

The Asian-Pacific Problem
South Asian, East Asian, and Southeast Asian populations develop type 2 diabetes, hypertension, and cardiovascular disease at substantially lower BMI values than Western reference populations. The WHO 2004 Expert Consultation, after reviewing data from 17 cohort studies across Asia, established adjusted thresholds: overweight at BMI ≥23.0 and obesity at ≥27.5. Indian, Chinese, and Japanese adults exhibit diabetic-equivalent insulin resistance at BMI 23 — a value classified as “Normal Weight” under standard WHO criteria.
Black and African Populations
The relationship reverses for many Black populations. African American and Sub-Saharan African adults often carry lower visceral fat at equivalent BMI compared to white populations, with proportionally more peripheral subcutaneous fat. Standard BMI thresholds may over-classify obesity risk in these populations, particularly for cardiovascular disease where visceral adiposity drives most pathology. Some researchers argue for population-adjusted upward shifts, though clinical consensus remains pending.
Hispanic and Latino Considerations
Mexican-American, Cuban-American, and Central American populations show mixed visceral fat patterns intermediate between Asian and European reference groups. Mexican-Americans develop type 2 diabetes at lower BMI than non-Hispanic whites but higher than East Asians. Clinical guidelines from the American Diabetes Association suggest screening Mexican-American adults at BMI ≥25 with additional risk factors rather than waiting for BMI ≥30.
Pacific Islander Adjustments
Native Hawaiian, Samoan, and Tongan populations exhibit higher baseline muscle mass and skeletal frame size, similar to athletic populations. WHO Pacific recommendations suggest alternate thresholds of overweight ≥26 and obesity ≥32. Standard BMI cutoffs systematically over-classify Pacific Islanders, similar to the Athlete Paradox in muscular populations.
06Gender Composition Differences
Identical BMI scores represent different body fat percentages in men and women due to hormonal and reproductive physiology. Women typically carry 8 to 10 percent more body fat than men at equivalent BMI values — a biological reality that the universal Quetelet formula fails to capture.
The 8-10% Body Fat Gap
Essential body fat requirements differ by sex. Men require approximately 3 percent essential fat for organ function and basic physiology. Women require 12 percent essential fat to maintain reproductive function, hormonal regulation, and pregnancy capability. This biological floor cascades upward through all BMI categories: a man with BMI 23 typically carries 15 to 20 percent body fat, while a woman with identical BMI 23 carries 23 to 28 percent. Both fall within “Normal Weight” classification despite carrying substantially different adipose tissue volumes.
Pregnancy Invalidates BMI Entirely
During pregnancy, BMI becomes fundamentally invalid as a screening tool. Gestational weight gain comprises amniotic fluid, expanded blood volume, placental tissue, breast tissue enlargement, and fetal growth — none of which represent adipose tissue accumulation. Clinical obstetrics relies on Gestational Weight Gain (GWG) targets established by the Institute of Medicine (2009), calibrated to pre-pregnancy BMI rather than current pregnancy weight.
Postpartum, hormonal stabilization and breastfeeding cause sustained physiological shifts in fluid retention and body composition. The American College of Obstetricians and Gynecologists recommends waiting 6 to 12 weeks postpartum before establishing a new baseline BMI for composition tracking.
07Statistical Origin Bias (Quetelet 1832)
BMI was created in 1832 by Belgian statistician Adolphe Quetelet for population demographics — not individual health diagnosis. Quetelet himself, in his original publication, explicitly warned against applying the formula to individual body fat assessment. The clinical community ignored this caveat for 190 years.
Quetelet’s Own Warning
Adolphe Quetelet published the index as part of his work on social physics, the statistical study of human populations. His 1832 paper “Sur l’homme et le développement de ses facultés” established the formula as a tool for comparing average body proportions across large populations. Quetelet specifically cautioned that the index applied to population averages, not individual diagnosis, and that variations in muscle, bone, and composition would distort individual readings. This warning, embedded in the foundational text, was lost to clinical practice for nearly two centuries.
The Sample Bias Problem
Quetelet’s original data derived from European white middle-class adult males — the demographic accessible to a 19th-century Belgian statistician. The sample excluded women (whose body composition differs from men by 8-10% body fat), children (whose proportions change developmentally), elderly individuals (sarcopenic obesity), ethnic minorities (visceral fat patterns vary), and athletes (muscle mass distorts the ratio). Modern BMI cutoffs descend from this biased sample, propagated through Keys (1972) and WHO (1995) without fundamental reassessment.
Why It Stuck for 190 Years
BMI’s persistence reflects three pragmatic factors rather than scientific superiority. First, calculation requires only height and weight — measurements available in any clinical setting at zero cost. Second, the metric correlates moderately well with body fat at the population level (r ≈ 0.7 to 0.8 in large cohorts), providing useful screening data for public health. Third, the life insurance industry adopted BMI-equivalent height-weight tables in the early 20th century, creating institutional momentum. None of these factors validate BMI as an individual diagnostic — they simply explain why a flawed tool became standard.
08Imperfect Mortality Correlation
The relationship between BMI and all-cause mortality forms a J-curve, not a linear trend. This challenges the foundational assumption that lower BMI always means lower risk — the actual mortality optimum sits in a narrower band than WHO classifications suggest.
The Lancet 2016 Mortality Meta-Analysis
The Global BMI Mortality Collaboration published the largest pooled analysis of BMI-mortality relationships in The Lancet (2016), encompassing 239 prospective studies and 10.6 million participants across four continents. The data revealed a distinct J-shaped curve: lowest all-cause mortality occurred at BMI 20 to 25, with mortality rising sharply below 18.5 and exponentially above 30.0. Critically, BMI 18.5 to 20 — within the WHO “Normal Weight” classification — showed elevated mortality risk comparable to BMI 25 to 27.
The “Obesity Paradox”
The mortality picture becomes more complex in specific populations. Elderly adults (over 70) with BMI 25 to 29 demonstrate better survival outcomes than those at BMI 20 to 24 — an inverted relationship termed the “obesity paradox.” Patients with heart failure, chronic obstructive pulmonary disease, and certain cancers similarly show survival advantages at higher BMI values. The mechanism likely involves nutritional reserves during acute illness, where lean mass and modest fat stores provide metabolic resilience.
Why the J-Curve Matters Clinically
The Lancet 2016 data has direct implications for individual health planning. The WHO “Normal Weight” range of 18.5 to 24.9 includes elevated-mortality zones at the lower end (18.5 to 20). The true mortality optimum sits in a narrower band — approximately BMI 22 to 24 for general adult populations. Patients pursuing weight loss should target this narrower optimum rather than the full WHO range, particularly older adults where lower-end BMI carries mortality penalties.
The AMA 2023 Reform — Official Recognition
In June 2023, the American Medical Association adopted Policy H-440.842, formally recognizing BMI’s imperfections and recommending contextual use alongside complementary metrics. This represents the most significant institutional reform of BMI usage in 28 years since WHO standardization in 1995.
What the AMA Statement Says
Policy H-440.842 explicitly acknowledges that BMI is “an imperfect way to measure body fat in multiple groups given that it does not account for differences across race/ethnic groups, sexes, genders, and age-span.” The policy recommends BMI be used in conjunction with measures of visceral fat, body adiposity index, body composition, relative fat mass, waist circumference, and genetic and metabolic factors. The AMA further noted historical harms from BMI-based clinical decisions, particularly regarding eating disorder diagnosis, surgical eligibility, and insurance coverage decisions.
What This Means for Clinical Practice
The AMA policy represents a paradigm shift from BMI-anchored decision-making toward multi-metric assessment. Clinical implications include reduced reliance on BMI alone for bariatric surgery eligibility, integration of waist circumference and body composition into routine screening, ethnically-adjusted thresholds for Asian and other populations, and greater clinical judgment regarding individual patient context. Insurance coverage criteria and clinical practice guidelines are gradually updating to reflect these recommendations.
Why It Took 28 Years (Since WHO 1995)
Institutional inertia explains the delayed reform. BMI’s adoption created enormous infrastructure dependencies: electronic health records, clinical guidelines, research protocols, insurance coverage criteria, surgical eligibility standards, and pharmaceutical trial inclusion criteria all operationalized BMI thresholds. Alternatives like DEXA scans, while clinically superior, remain too expensive and access-limited for population-wide adoption. The AMA reform represents pragmatic acknowledgment of limitations rather than wholesale replacement — a “use better, don’t abandon” position consistent with available alternatives.
Beyond BMI — Clinically Superior Metrics
Five clinically validated metrics outperform BMI for specific populations and use cases. Waist-to-height ratio, body fat percentage, DEXA scans, waist circumference, and Fat-Free Mass Index each address specific limitations of the Quetelet Index.

| Metric | What It Measures | Best For |
|---|---|---|
| Waist-to-Height Ratio (WHtR) | Central adiposity proxy | Universal screening |
| Body Fat % (Skinfold/BIA) | Adipose tissue percentage | Fitness tracking |
| DEXA Scan | Bone, fat, and lean mass | Clinical precision |
| Waist Circumference | Absolute abdominal fat | Metabolic syndrome |
| Fat-Free Mass Index (FFMI) | Lean mass per height² | Athletes |
Waist-to-Height Ratio (WHtR < 0.5)
WHtR represents the most accessible alternative to BMI for cardiovascular and metabolic risk screening. Maintaining waist circumference below half of standing height correlates with lowest disease risk across age groups, ethnicities, and body compositions. The Ashwell Shape Chart, validated through meta-analysis of over 300,000 subjects, demonstrates that WHtR outperforms BMI in predicting cardiovascular events, type 2 diabetes onset, and metabolic syndrome diagnosis. Calculation requires only a tape measure: divide waist in centimeters by height in centimeters.
Body Fat Percentage (Skinfold or BIA)
Direct measurement of adipose tissue percentage provides clinically actionable composition data. Skinfold calipers (when used by trained operators) achieve 3 to 5 percent accuracy at substantially lower cost than DEXA. Consumer-grade bioelectrical impedance scales provide 4 to 8 percent accuracy with day-to-day consistency suitable for trend monitoring. Reference ranges: athletic men 6 to 13 percent, fit men 14 to 17 percent, athletic women 14 to 20 percent, fit women 21 to 24 percent.
DEXA Scan Gold Standard
Dual-energy X-ray absorptiometry remains the clinical gold standard for body composition analysis. DEXA provides precise quantification of bone mineral density, lean tissue mass, and fat tissue mass across distinct body regions (trunk, arms, legs). Clinical research, sports performance settings, and bariatric surgery candidate evaluation rely on DEXA for definitive composition data. Cost ranges 75 to 150 USD per scan in clinical facilities.
When BMI Is Still Useful
Despite documented limitations, BMI retains clinical utility for three specific scenarios: large-scale population screening, surgical eligibility thresholds, and longitudinal individual tracking. The AMA 2023 reform recommends contextual use, not abandonment.
For population-level public health surveillance, BMI provides standardized, zero-cost screening data essential for tracking obesity trends across demographics. National Health and Nutrition Examination Survey programs, WHO Global InfoBase, and CDC monitoring systems all rely on BMI for population comparison. Replacement with composition-based metrics would require infrastructure that does not currently exist at scale.
Bariatric surgery eligibility remains BMI-anchored: ≥40 standalone, or ≥35 with comorbidity. GLP-1 receptor agonist prescription criteria similarly require BMI thresholds (≥30, or ≥27 with comorbidities). While clinically imperfect, these thresholds provide objective access criteria that prevent arbitrary insurance denials. Until alternative metrics achieve equivalent standardization, BMI gatekeeping persists.
For individual longitudinal tracking, BMI provides useful trend data when interpreted appropriately. A patient whose BMI rises from 24 to 28 over five years has accumulated meaningful weight regardless of composition specifics. The trajectory itself carries clinical signal, particularly when combined with waist circumference monitoring and metabolic markers.
Frequently Asked Questions
BMI has 8 documented clinical limitations: inability to measure body composition, systematic misclassification of athletes (the Athlete Paradox), failure to detect sarcopenic obesity in seniors, blindness to the MONW phenomenon, ethnic and racial variability bias, gender composition differences, statistical origin bias from Quetelet’s 1832 sample, and imperfect mortality correlation per the Lancet 2016 J-curve analysis.
BMI systematically overestimates body fat in athletes because muscle tissue density (1.06 g/cm³) exceeds adipose tissue density (0.9 g/cm³) by 18 percent. NFL linebackers register an average BMI of 31 (Obese Class I) while carrying only 10 to 14 percent body fat, demonstrating BMI’s failure in muscular populations. The Fat-Free Mass Index (FFMI) provides a better alternative for athletic body composition assessment.
No. The American Medical Association 2023 Policy H-440.842 recommends using BMI contextually alongside waist circumference and body composition analysis, not abandoning it entirely. BMI remains valuable for large-scale screening programs, bariatric surgery eligibility determinations, and longitudinal trend tracking when interpreted with appropriate clinical nuance. The reform is “use better, not abandon.”
DEXA scan represents the clinical gold standard for body composition analysis, providing precise quantification of fat mass, lean mass, and bone mineral density. For accessible alternatives, waist-to-height ratio below 0.5 outperforms BMI in predicting visceral adiposity and cardiovascular events across all populations, per the Ashwell meta-analysis of over 300,000 subjects.
No, adult BMI thresholds do not apply to individuals under 18. The CDC uses age- and sex-specific BMI percentile charts where the 85th percentile indicates overweight and the 95th percentile indicates obesity. Pediatric assessment requires the BMI-for-age growth charts, not adult cutoffs. Standard adult classifications applied to children produce systematic misclassification.
No, BMI is fundamentally invalid during pregnancy. Gestational weight comprises amniotic fluid, expanded blood volume, placental tissue, and fetal growth — completely distorting the Quetelet formula. Clinical obstetrics uses Gestational Weight Gain targets based on pre-pregnancy BMI per the Institute of Medicine 2009 guidelines. ACOG recommends 6 to 12 weeks postpartum stabilization before re-establishing BMI baseline.
The American Medical Association adopted Policy H-440.842 in June 2023, formally acknowledging BMI’s imperfections and recommending it be used contextually alongside waist circumference, body composition analysis, and metabolic markers. The policy represents the most significant institutional reform of BMI usage in 28 years since WHO standardization in 1995. Clinical guidelines, insurance criteria, and surgical eligibility standards are gradually updating to reflect this multi-metric approach.

Move Beyond BMI — Explore Better Body Composition Tools
VisualBody Lab provides clinical-grade calculators for waist-to-hip ratio, body fat percentage, and TDEE alongside the BMI calculator. Build a complete picture of your metabolic health, not a single misleading number.
Calculate Your BMI in ContextBased on Scientific Sources
- American Medical Association. Adoption of policy H-440.842: Clarifying the role of BMI as a measure in medicine; 2023. → AMA Statement
- Global BMI Mortality Collaboration. Body-mass index and all-cause mortality: individual-participant-data meta-analysis of 239 prospective studies in four continents. The Lancet; 2016. → PubMed
- WHO Expert Consultation. Appropriate body-mass index for Asian populations and its implications for policy and intervention strategies. The Lancet; 2004. → PubMed
- Nuttall FQ. Body Mass Index: Obesity, BMI, and Health: A Critical Review. Nutrition Today; 2015. → PubMed
- Ashwell M, Gunn P, Gibson S. Waist-to-height ratio is a better screening tool than waist circumference and BMI for adult cardiometabolic risk factors: systematic review and meta-analysis. Obesity Reviews; 2012. → PubMed
- Cruz-Jentoft AJ, et al. Sarcopenia: revised European consensus on definition and diagnosis (EWGSOP2). Age and Ageing; 2019. → PubMed