Asian BMI Thresholds: WHO 2004 Population-Specific Cutoffs
Why South Asian, East Asian, Southeast Asian, and Pacific Islander populations require adjusted BMI cutoffs. Country-by-country breakdown with clinical interpretation — from India’s BMI 22 diabetes threshold to Japan’s ideal weight target of 22.
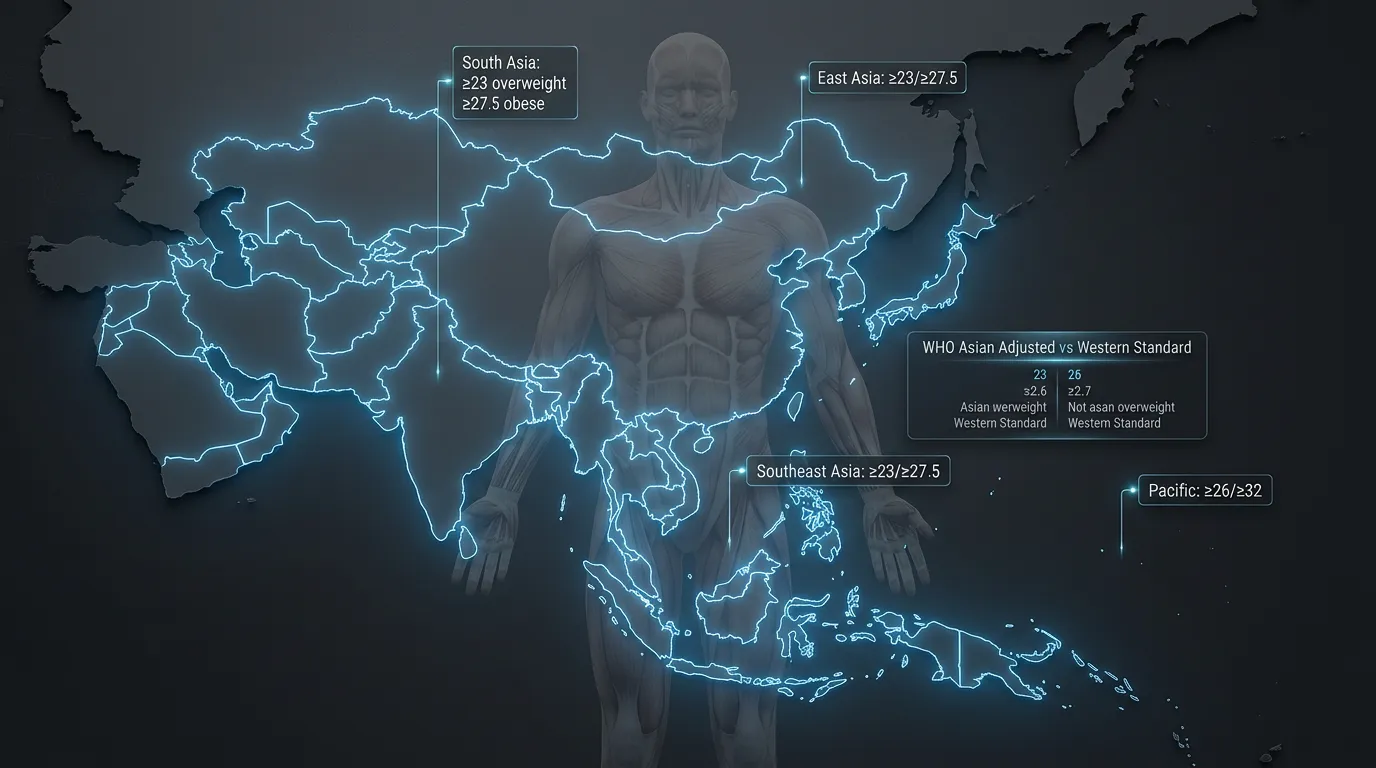
Asian populations require adjusted BMI thresholds: overweight ≥23.0 and obesity ≥27.5 kg/m² per WHO 2004 Expert Consultation. The biological basis includes elevated visceral-to-subcutaneous fat ratios, earlier insulin resistance onset, and reduced pancreatic beta-cell function compared to Western populations. South Asian adults exhibit the strongest deviation — type 2 diabetes risk emerges at BMI 22, a 5-unit downward shift from Western screening thresholds.
| Classification | WHO Standard | WHO Asian-Adjusted |
|---|---|---|
| Normal Weight | 18.5 – 24.9 | 18.5 – 22.9 |
| Overweight | ≥ 25.0 | ≥ 23.0 |
| Obese | ≥ 30.0 | ≥ 27.5 |
| Pacific Islander Overweight | ≥ 25.0 | ≥ 26.0 |
| Pacific Islander Obese | ≥ 30.0 | ≥ 32.0 |
Source: WHO Expert Consultation on Appropriate BMI for Asian Populations (Lancet, 2004)
Why Asian Populations Need Different BMI Thresholds
South Asian, East Asian, and Southeast Asian adults develop type 2 diabetes and cardiovascular disease at BMI values where Western populations remain metabolically healthy. The biological mechanisms include elevated visceral fat distribution, earlier insulin resistance, and beta-cell dysfunction at lower BMI scores.
Standard WHO BMI thresholds (overweight ≥25, obese ≥30) derive from mortality and morbidity data in European and North American populations. When applied to Asian populations, these cutoffs systematically miss cardiometabolic risk. A Vietnamese adult at BMI 24 may exhibit insulin resistance, central adiposity, and elevated blood pressure characteristic of Western obesity — invisible to standard screening.
The disconnect reflects genuine biological differences, not measurement error. Asian populations across South Asia, East Asia, and Southeast Asia share patterns of fat distribution and metabolic response that diverge from European reference populations. These differences emerge from genetic, developmental, and environmental factors that have evolved over millennia.
The WHO 2004 Expert Consultation
In 2004, the WHO convened 17 international experts to review BMI thresholds for Asian populations after a decade of mounting evidence that standard cutoffs underestimated cardiometabolic risk in the region. The consultation analyzed cohort data from over 100,000 participants across multiple Asian countries.

What Triggered the Reform
By the late 1990s, clinical reports from India, China, Japan, and Southeast Asia consistently demonstrated that adult populations developed type 2 diabetes and cardiovascular disease at BMI values where Western populations remained healthy. National diabetes prevalence in India and China was rising rapidly, with substantial proportions of newly diagnosed patients carrying BMI below the WHO obesity threshold of 30.0. Researchers across the region published over 200 peer-reviewed papers between 1995 and 2003 questioning the applicability of Western BMI cutoffs to Asian populations.
The 17-Cohort Analysis
The WHO consultation pooled data from 17 prospective cohort studies spanning Bangladesh, China, India, Indonesia, Japan, Pakistan, Singapore, South Korea, Thailand, and Vietnam. The total sample exceeded 100,000 participants tracked for cardiometabolic disease outcomes including type 2 diabetes onset, hypertension, dyslipidemia, and cardiovascular events. The analysis identified BMI inflection points where disease risk began rising substantially — consistently lower than Western thresholds.
Final Recommendations
The consultation published its findings in The Lancet (2004), formally establishing adjusted thresholds for Asian populations: overweight at BMI ≥23.0 and obesity at ≥27.5. For Pacific Islander populations including Native Hawaiian, Samoan, Tongan, and Fijian adults, the consultation recommended upward adjustment to overweight ≥26.0 and obese ≥32.0, reflecting higher baseline muscle mass and skeletal frame size. These recommendations remain the international standard 22 years later, adopted by national health ministries across the Asia-Pacific region.
The Biological Basis — Why Asian Bodies Differ
Asian populations exhibit elevated visceral-to-subcutaneous fat ratios, earlier insulin resistance, and reduced pancreatic beta-cell function at lower BMI values. The clinical manifestation is the TOFI phenomenon — Thin Outside, Fat Inside — where outwardly slim Asian adults carry dangerous visceral fat accumulation invisible to BMI screening.
The TOFI Phenomenon (Thin Outside, Fat Inside)
TOFI describes a body composition pattern common in Asian populations: normal or slim outer appearance combined with substantial intra-abdominal visceral fat. A 30-year-old Vietnamese male at BMI 22 may appear lean by visual assessment yet carry 25 percent body fat concentrated around liver, kidneys, and intestinal mesentery. The clinical consequences match those of visible obesity — insulin resistance, atherogenic dyslipidemia, hypertension, and elevated diabetes risk.

Visceral vs Subcutaneous Fat Distribution
At equivalent BMI, Asian populations carry approximately 30 to 40 percent more visceral fat compared to European populations. Visceral adipose tissue surrounds internal organs and drives metabolic dysfunction through inflammatory cytokine release, portal vein insulin delivery, and free fatty acid flux to the liver. This pattern contrasts with European populations who preferentially store excess energy as subcutaneous fat in peripheral tissues, which carries substantially lower cardiometabolic risk per unit mass.
Beta-Cell Function Differences
Pancreatic beta-cells in Asian populations exhibit reduced compensatory insulin secretion capacity in response to insulin resistance. Where Western populations may compensate for emerging insulin resistance through hyperinsulinemia maintained over years, Asian populations demonstrate earlier beta-cell decompensation. The result is faster progression from insulin resistance to overt type 2 diabetes at lower BMI values. Clinical onset typically occurs 5 to 10 years earlier in Asian populations compared to age-matched Western cohorts.
South Asian BMI Thresholds
Indian, Pakistani, Bangladeshi, and Sri Lankan adults exhibit the strongest deviation from Western BMI norms — diabetes risk emerges at BMI 22, a 5-unit downward shift in clinical screening threshold. South Asian populations may benefit from even lower cutoffs than the WHO 2004 standard.
Country-Specific Data
Indian adults demonstrate the most extreme BMI-diabetes risk gradient globally. Type 2 diabetes prevalence reaches 17 percent at BMI 23 versus 3 percent at BMI 20 — a 5.7-fold increase across a 3-unit BMI range. The Indian Diabetes Federation recommends screening at BMI ≥23, with metabolic syndrome assessment at ≥25.
Pakistani adults exhibit cardiovascular disease risk gradients similar to Indian populations. The Pakistan National Diabetes Survey 2017 confirmed type 2 diabetes prevalence of 26.3 percent in adults ≥25 years, with substantial proportion at normal-BMI values. Clinical screening thresholds follow South Asian-specific WHO recommendations.
Bangladeshi type 2 diabetes prevalence increased from 4 percent in 1995 to 14 percent in 2020 — paralleling rising BMI without reaching Western obesity thresholds. National guidelines apply WHO Asian cutoffs (≥23 overweight, ≥27.5 obese) with additional waist circumference screening.
South Asian-Specific Cutoffs
Some researchers argue that South Asian populations warrant even lower thresholds than the WHO 2004 standard. Misra et al. (2009) proposed overweight at BMI ≥23.0 and obesity at ≥25.0 for South Asian populations — a more aggressive adjustment reflecting the steeper diabetes risk gradient. The International Diabetes Federation has not formally adopted these lower cutoffs, but clinical practice in India and Pakistan increasingly screens for metabolic syndrome at BMI 23 to 25.
East Asian BMI Thresholds
Chinese, Japanese, and Korean populations demonstrate intermediate BMI risk profiles between South Asian and Western norms. National guidelines vary slightly across countries but generally apply WHO 2004 thresholds with country-specific adjustments.

Country-Specific Data
Chinese national guidelines apply WHO Asian thresholds with national specificity. The Working Group on Obesity in China (WGOC) defines overweight at BMI ≥24 and obesity at ≥28 — slightly modified from WHO 2004. Approximately 30 percent of normal-BMI Chinese adults exhibit metabolic syndrome markers, validating the lower screening thresholds. Type 2 diabetes prevalence reached 12.8 percent of adults by 2017.
Japanese national diabetes guidelines recommend BMI 22 as the ideal target, with 25 marking overweight — substantially lower than the WHO Western standards. The Japan Society for the Study of Obesity (JASSO) defines obesity at BMI ≥25, the most aggressive cutoff among major Asian countries. Japanese type 2 diabetes prevalence is notably lower (7.4 percent) compared to other East Asian countries, partially attributed to early intervention at lower BMI thresholds.
Korean national guidelines define overweight at BMI ≥23 and obesity at ≥25 — closely matching Japanese thresholds. The Korean Society for the Study of Obesity (KSSO) has progressively lowered cutoffs as evidence accumulated. Korean diabetes prevalence reached 13.8 percent in 2020, prompting national screening at BMI ≥23 with waist circumference assessment.
East Asian Application Notes
East Asian populations residing outside their countries of origin retain elevated cardiometabolic risk at lower BMI. Korean Americans, Japanese Americans, and Chinese Americans should be screened using Asian-adjusted thresholds rather than US national cutoffs. The American Diabetes Association formally recommends BMI ≥23 screening for Asian American adults (Hsu et al., Diabetes Care 2015) — a guideline that remains underutilized in US primary care settings.
Southeast Asian BMI Thresholds
Vietnamese, Thai, Filipino, Indonesian, and Malaysian populations exhibit cardiometabolic risk patterns closer to South Asian than East Asian profiles. WHO 2004 thresholds (≥23 overweight, ≥27.5 obese) apply broadly across Southeast Asia with national variations.
Country-Specific Data
Vietnamese national diabetes prevalence reached 7.3 percent in 2020 per the National Diabetes Survey, with substantial proportion of patients at normal-BMI by Western standards. Vietnamese adults at BMI 23 to 24.9 carry type 2 diabetes risk equivalent to Western adults at BMI 27 to 28. The Vietnam Ministry of Health applies WHO 2004 Asian thresholds in national screening guidelines.
Thai national endocrine guidelines define overweight at BMI ≥23 and obesity at ≥25 — closely matching Japanese and Korean standards. Thailand’s diabetes prevalence reached 9.5 percent in 2020, with metabolic syndrome affecting approximately 21 percent of adults. The Thai Endocrine Society emphasizes waist circumference screening alongside BMI for accurate risk assessment.
Indonesian Ministry of Health applies WHO 2004 thresholds with national adaptation. Diabetes prevalence increased from 5.7 percent in 2007 to 10.9 percent in 2018, with substantial undiagnosed proportion. National screening occurs at BMI ≥23 with additional risk factor assessment for individuals at BMI 18.5 to 22.9 with family history.
Filipino populations show diabetes prevalence of 6.3 percent with substantial regional variation. The Philippine Society of Endocrinology, Diabetes and Metabolism applies WHO Asian thresholds. Filipino adults exhibit cardiometabolic risk patterns intermediate between Vietnamese and Indonesian profiles.
Malaysian national health surveys report adult overweight prevalence of 30 percent and obesity of 19 percent at WHO Asian thresholds. The Malaysian Ministry of Health applies BMI ≥23 overweight and ≥27.5 obese in clinical guidelines, with additional ethnicity-specific considerations for the multi-ethnic Malaysian population including Chinese, Indian, and Malay subgroups.
Southeast Asian Application Notes
Southeast Asian populations exhibit substantial heterogeneity. Ethnically Chinese minorities in Southeast Asian countries (Singapore, Malaysia, Indonesia) generally follow East Asian patterns. Ethnically Indian minorities follow South Asian patterns. Indigenous Southeast Asian populations (Vietnamese, Thai, Filipino, Khmer, Burmese) follow Southeast Asian-specific patterns with high TOFI prevalence and early diabetes onset.
Pacific Islander Considerations
Native Hawaiian, Samoan, Tongan, and Fijian populations exhibit higher baseline muscle mass and skeletal frame size, requiring upward-adjusted BMI thresholds. The WHO 2004 consultation recommended overweight ≥26.0 and obese ≥32.0 for Pacific Islander populations — opposite direction from Asian adjustments.
Pacific Islander body composition resembles athletic populations more than Asian populations. Higher proportions of lean muscle mass, denser skeletal structure, and proportionally larger frame size mean standard BMI cutoffs systematically over-classify Pacific Islanders as obese. The pattern parallels the Athlete Paradox documented in Western populations.
However, Pacific Islander populations also exhibit elevated diabetes and cardiovascular disease prevalence compared to neighboring populations. The clinical interpretation requires nuance: BMI alone systematically misrepresents Pacific Islander cardiometabolic risk in both directions. Waist circumference, body fat percentage, and metabolic markers provide more reliable screening data than BMI for these populations.
Health Implications at Asian-Adjusted Thresholds
Type 2 diabetes risk increases 2 to 4-fold at Asian-adjusted BMI 23 versus BMI 21. Cardiovascular disease, metabolic syndrome, and hypertension follow similar elevated risk gradients at BMI values where Western populations remain low-risk.

Diabetes Risk Profile
Type 2 diabetes prevalence rises sharply across BMI 22 to 27 in Asian populations. South Asian adults at BMI 25 carry diabetes risk equivalent to European adults at BMI 30. East Asian populations show similar but slightly less extreme gradients. The mechanism involves earlier insulin resistance combined with reduced beta-cell compensation, producing faster progression from normoglycemia to type 2 diabetes onset.
Cardiovascular Risk Gradient
Cardiovascular disease prevalence rises approximately 60 percent for each 5-unit BMI increase above 22 in Asian populations, compared to 40 percent in European reference populations. The accelerated gradient reflects visceral fat-mediated atherosclerosis acceleration and elevated lipoprotein particle abnormalities at lower BMI values. Hypertension, dyslipidemia, and coronary artery disease all follow this steeper Asian-specific gradient.
Metabolic Syndrome at Lower BMI
Metabolic syndrome — the constellation of central obesity, hypertension, dyslipidemia, and insulin resistance — affects approximately 30 percent of normal-BMI Chinese adults compared to 8 to 18 percent in Western populations. The phenomenon validates the lower screening thresholds: Asian adults at BMI 23 to 25 require the same level of clinical attention as Western adults at BMI 28 to 30.
How to Apply Asian Thresholds in Clinical Practice
Apply Asian-adjusted BMI thresholds when patient ancestry includes South Asian, East Asian, Southeast Asian, or mixed Asian origin. The American Diabetes Association formally recommends BMI ≥23 screening for Asian American adults, applicable regardless of country of birth or residence.
Clinical Decision Framework
Three patient categories should be screened using Asian-adjusted thresholds. First, adults of full Asian ancestry from any country of birth or residence. Second, adults of mixed Asian and other ancestry where Asian ancestry comprises 25 percent or more. Third, adults with documented Asian-pattern body composition (waist circumference disproportionate to BMI, family history of early-onset type 2 diabetes, ethnically Asian first-degree relatives).
Mixed-Ancestry Patients
Mixed-ancestry patients present clinical interpretation challenges. Half-Asian adults typically retain partial Asian-pattern cardiometabolic risk, warranting intermediate screening thresholds (BMI ≥24 for overweight assessment). Clinical judgment incorporates family history, waist circumference, and metabolic markers alongside BMI for these patients.
Supplementary Screening Tools
BMI alone — even with Asian adjustment — provides incomplete cardiometabolic assessment in Asian populations. Standard practice combines BMI with waist circumference (men <90 cm, women <80 cm per WHO Asian standards), waist-to-height ratio (target <0.5), fasting glucose, lipid panel, and blood pressure monitoring. Comprehensive metabolic assessment captures TOFI individuals invisible to BMI screening alone.
Beyond BMI for Asian Populations
Even with Asian-adjusted thresholds, BMI alone misses metabolic risk in TOFI individuals. Waist-to-height ratio and waist circumference provide superior screening for visceral adiposity in Asian populations.
The Ashwell Shape Chart, based on meta-analysis of over 300,000 subjects across multiple ethnicities, demonstrates that waist-to-height ratio (WHtR) outperforms BMI in predicting cardiovascular events and type 2 diabetes onset across all populations including Asian. Target WHtR below 0.5 indicates low cardiometabolic risk regardless of BMI classification. Calculation requires only a tape measure: divide waist in centimeters by height in centimeters.
Frequently Asked Questions
The Asian-adjusted Normal Weight range is 18.5 to 22.9 kg/m² per WHO 2004 Expert Consultation. Overweight begins at BMI 23.0 and obesity at 27.5, both lower than Western thresholds of 25 and 30. These adjustments reflect elevated cardiometabolic risk at lower BMI values across South Asian, East Asian, and Southeast Asian populations.
Asian populations exhibit higher visceral-to-subcutaneous fat ratios, earlier insulin resistance onset, and reduced pancreatic beta-cell function at equivalent BMI values compared to Western populations. The TOFI phenomenon (Thin Outside, Fat Inside) means slim Asians can carry dangerous visceral fat at BMI 22 to 24 — invisible to standard BMI screening.
The WHO 2004 thresholds (≥23 overweight, ≥27.5 obese) apply broadly across South Asian, East Asian, and Southeast Asian populations. However, country-specific national guidelines may differ slightly: Japan recommends BMI 22 as ideal, Korea uses ≥23 overweight and ≥25 obese, China generally follows WHO Asian standards. Pacific Islander populations require higher thresholds (≥26 overweight, ≥32 obese).
Vietnamese adults follow WHO 2004 Asian thresholds: overweight at BMI ≥23.0 and obesity at BMI ≥27.5. The Vietnam National Diabetes Survey confirms that adults at BMI 23 to 24.9 carry type 2 diabetes risk equivalent to Western adults at BMI 27 to 28, validating these adjusted cutoffs for Vietnamese populations.
Yes. The American Diabetes Association recommends screening Asian American adults at BMI ≥23 (vs ≥25 for other populations) per Hsu et al., Diabetes Care 2015. Asian Americans retain the biological characteristics of their ancestral populations including elevated visceral fat distribution and earlier insulin resistance onset, regardless of country of residence.
Yes. The WHO 2004 Expert Consultation officially established the 23.0 and 27.5 thresholds. The American Diabetes Association, Asian-Pacific Working Group on Obesity, International Diabetes Federation, and national health ministries across India, China, Japan, Korea, Vietnam, and Thailand have adopted these or similar population-specific cutoffs in clinical guidelines.

Calculate Your BMI with Asian-Adjusted Thresholds
The VisualBody Clinical BMI Calculator includes an Asian-adjusted threshold toggle, showing your classification under both Western and WHO 2004 Asian standards — essential for accurate clinical interpretation across all Asian populations.
Open BMI CalculatorBased on Scientific Sources
- WHO Expert Consultation. Appropriate body-mass index for Asian populations and its implications for policy and intervention strategies. The Lancet; 2004. → PubMed
- Misra A, et al. Consensus Statement for Diagnosis of Obesity, Abdominal Obesity and the Metabolic Syndrome for Asian Indians. JAPI; 2009. → PubMed
- Pan WH, Yeh WT. How to define obesity? Evidence-based multiple action points for public awareness, screening, and treatment: an extension of Asian-Pacific recommendations. Asia Pac J Clin Nutr; 2008. → PubMed
- Hsu WC, et al. BMI Cut Points to Identify At-Risk Asian Americans for Type 2 Diabetes Screening. Diabetes Care; 2015. → PubMed
- International Diabetes Federation. IDF Diabetes Atlas, 10th Edition; 2021. → IDF Diabetes Atlas